


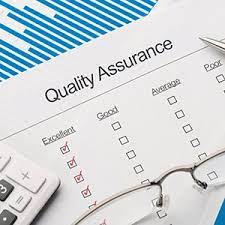
According to the Institute of Medicine, USA, patient safety is part of the discipline of Quality. In general all world talk about Quality and Patient Safety and in many cases of Quality Assurance, as a whole, involving both disciplines.
Although they use many tools in common, the two disciplines have differences. The quality is oriented to the improvement of the performance or efficiency of the system, while the Patient Safety is oriented to decrease the Error.
Safety has had a lot of marketing and many wills working on it, but we should not forget about Quality, as it is a broader concept and also improves safety.
Example: the time to apply a drug after an incident, is a topic of Quality. The lack of consultation, with the Pharmacy, for a missing data, is a subject of Patient Safety. Both affect the quality of care.
It does not make sense to work in Safety if we do not work simultaneously to improve Quality.
Both issues have important financial implications. The improvement of Quality, reduces waste (frequently estimated at 30%) and improving in Safety improves re-jobs and the time of permanence of the patient, among other things.
In health issues, CQI or Continuos Quality Improvement is a trend based on TQM or Total Quality Management that Dr. Deming applied to quality improvement in Japan.
PDCA
Plan – Do – Check – Analyze. (Prepare – make the change – check the results – analyze the next step)
Also called PDSA, or Plan, Do, Study, Act. We put it first, in this blog, because it should be the most used tool by all. It is almost a vice for those responsible for quality. A way of seeing things. They maintain several PDCAs in study simultaneously. It is a tool that can be applied to any type of organizational problem, even for the study of a row. Its use is recommended in a successive way, that is, after finishing a PDCA another one begins, on the same subject, improving the indicators of the previous one. When the problem is already well adjusted and one must work more adjustable, the use of other tools such as the DMAIC is recommended.

The PDCA name indicates the following steps:
- Plan:
- Define the problem to be improved.
- Define the purpose of the study.
- Focus on this.
- Plan the Study
- Do:
- Train the people who will be in control.
- Run the study
- Check:
- Check how the control was done
- Prepare the indicators
- Analyze:
- If the intended objectives were achieved, confirm and secure the change, with more measures.
- If the objectives were not met, define what should change and start a new PDCA.

PDCA – Next steps
The use of successive PDCA is a necessity and defines for potentiality of this tool, to get to the core of the issue. The P phase objectives of the second PDCA can be modified and improved over the previous PDCA.
THE 5 WHY
WHY? – WHY? – WHY? -WHY? – WHY?
It is a simple technique that forces us to avoid simplistic answers and to continue deepening the search for the first causes (dig-in).
Precisely one of the keys of the HRO, or High Reliable Organizations, is never accept answers that have not dug deep into the root of the problem.
Example: The nurse did not consult her question about the use of a medication.
- Why? The pharmacist’s phone was busy for several minutes.
- Why? This phone is always busy.
- Why? The Pharmacy delays many time on some calls.
- Why? Because the information has to be searched in physical files.
- Why? Because there is not a program and a computer at the pharmacy table, to find the answers quickly.
You do not need to stop here and you can go further, until you have a satisfactory answer that indicates that we have reached the first cause.
ISHIKAWA DIAGRAM – FISH SPINE
This diagram seeks to arrive at the initial causes of each problem, began with Ishikawa, applying it to industry and classifying it into 4 items or 4M: labor, materials, media (machines) and methods. It was later extended to other causes and adapted to the health sector.

Got from site www.nthsa.gov
Each spine opens itself to new causes. All of the same category are grouped together.
PARETO
The Pareto principle tells us that 80% of the effects originate in 20% of the causes.
This railway engineer based in Italy and born in France in 1848, discovered how this principle is valid in many fields of study.
Although it does not apply exactly in the 80-20 ratio, it does have surprising validity as a general principle and helps us to focus on a small number of elements to study.
As a derivation of the principle is the cumulative Pareto diagram. Then, as accumulated frequency:

As factors A and B reach 77%, very close to 80%, you´ll probably want to stop and study only these two factors and leave the rest for another study.
After the correction of the problem, you will make a new Pareto and the relations will have changed and maybe now the C eill enter inside new causes to study.
SWISS CHEESE MODEL
The Swiss Cheese Model was created by Dr. James Reason, a psychiatrist specialized in the study of accidents and risks when he was a professor in England.
The model introduces us to the concept of latent faults inside a system. It uses the concept of the catalyst elements, or triggers, which came from the theory of complex elements, and that the lack of barrier elements, another concept introduced, make possible an error or incident. The holes (of the cheese) are potential failures, neglected in each category and with potential to let the problem pass.
The simplicity of the presentation, which says that when the holes of the cheese are aligned, an incident is generated, generated the popularization of the Model. It serves for the analysis of any cause of failures. Dr. Reason says the use of one or two barriers, at the end of the processes, prevents the failure from happening.

We recommend reading the book The Human Contribution by James Reason, which points out the importance of humans in the control tasks and recommends the adoption of control barriers at the end of the processes.

ROOT CAUSE ANALYSIS – RCA
Usually used as a posterior study to and incident or reagent, it searches for layers, the cause or causes of each fault. It is based on Graph Theory, based on logic and mathematics that graphs with nodes, the relations between causes and effects.
This method is doing a mining (dig in) of the information using also the technique of why´s of each stage.
In medicine, Agregate RCA has been used as a pro-active method to study several cases and define trends that lead to a decrease in error.
There is also the RCFA, root cause failure analysis, brought from engineering.

FAILURE MODE AND EFFECTS ANALYSIS – FMEA and HFMEA
Used to prevent incidents, this tool developed by NASA introduces the probalistic calculation, both in the possibility of an incident occurring at a certain level, and in the potential effects of that incident.
In health, HFMEA or Health Failure Mode and effects Analysis has been used. The 5 steps of it are:
- Define the topic.
- Assemble the team of professionals.
- Develop the map of the process to be studied.
- Conduct risk analysis, through a cause-and-effect tree.
- Develop the actions to take to achieve the desired results and indicate who will be responsible for each action.
This tool has frequently led to the recognition of the need to have a defined Taxonomy (categorization) and a standardized terminology and disseminated in training to all professionals involved.
LEAN – SIX SIGMA
The combination of LEAN and 6 Sigma methodologies gave birth to this discipline.
Diffused through professional certifications such as Green belt, black belt, etc. It serves to train people in a system that aims to decrease, both waste and errors.
Its main tool is DMAIC: define, measure, analyze, improve, and control. That is, define the subject or process to study, measure, analyze, improve and control.
SIX SIGMA refers to the statistical parameter that establishes a probability of 99.99966% that a defect does not occur, that is, 3.4 defects per million of events and that was developed by Motorola and then spread to all industries. The method is based on accurately measuring the problems, until correcting them with their tools.
LEAN is a methodology developed mainly from Toyota control techniques. Based on eliminating everything that does not deliver value to the customer, it is aimed at reducing waste of time, material, space and so on.
It uses the insertion of a “positive control” or poka yoke to avoid errors by the force of the mechanisms.

DMAIC is undoubtedly the most complete tool among all the above.
We wanted to increase the interest of professionals in these issues.
The total mastery of them requires an appropriate and extensive Course, which exceeds the possibilities of this blog.